

Grafana 如何监控 Nginx 状态
grafana 如何监控 nginx 状态
查询 nginx 是否启用 stub_status 模块
- 终端输入,如果有返回结果,则说明 nginx 启用了 stub_status 模块
1
nginx -V 2>&1 | grep -o with-http_stub_status_module
- 终端输入,如果有返回结果,则说明 nginx 启用了 stub_status 模块
在 nginx 配置文件中 配置以下 location 块
1
2
3
4
5
6
7
8
9
10
11
12
13
14
server {
listen 8088; # 使用一个不常用的端口
server_name 172.22.199.119; # 可以监听 Nginx 服务器的实际 IP
location /nginx_status {
stub_status on;
# 允许 Nginx Prometheus Exporter 所在的服务器 IP 访问
allow 172.22.199.119; # 如果 Nginx Exporter 和 Nginx 在同一台机器上,用这个
allow 127.0.0.1; # 放行其他ip(可以试试公网ip)
# 如果 Nginx Exporter 在另一台机器上(例如 172.22.199.120),请将此行替换为 Exporter 的 IP
# allow 172.22.199.120;
deny all; # 拒绝其他所有 IP 访问,增强安全性
}
}为什么需要安装 Nginx Prometheus Exporter
1
2
3
Nginx Exporter(特指 nginx-prometheus-exporter)是一个独立的程序,作为 Nginx 和 Prometheus(Grafana 通常从 Prometheus 获取数据)之间的桥梁。
Nginx 本身通过 stub_status 模块(如 /nginx_status)提供基本运行状态信息,但这些信息是简单的文本格式,Prometheus 无法直接理解。Nginx Exporter 访问 Nginx 状态页面(如 http://your-nginx-ip:8088/nginx_status),读取原始数据并将其转换为 Prometheus 可理解的指标格式(通常是带有特定标签的时间序列数据)。
Prometheus 服务器定期从 Nginx Exporter 暴露的 URL(例如 http://exporter-ip:9113/metrics)抓取转换后的指标数据并存储。Grafana 连接到 Prometheus 数据源,查询并展示这些指标数据。通常有为 Nginx Exporter 预制的 Grafana 仪表盘。因此,安装 Nginx Exporter 是为了将 Nginx 原生状态信息转换为 Prometheus 和 Grafana 可处理的标准化指标数据。在 Nginx 服务器上配置 Nginx Prometheus Exporter
1
2
3
4
5
6
7
8
9
10
11
nginx-exporter:
image: nginx/nginx-prometheus-exporter:latest # 使用 latest 标签
container_name: nginx-exporter # 容器名称与 docker run 一致
restart: unless-stopped # 等效于 docker run 的 -d (后台运行) 的持久化行为
# command 部分对应 docker run 中 --nginx.scrape-uri 参数后面的内容
command:
- '--nginx.scrape-uri=http://172.22.199.119:8088/nginx_status' # 与你的 docker run 命令一致
ports:
- "9113:9113" # 对应 docker run 的 -p 9113:9113
networks:
- my-custom-net # 加入你现有的网络检查端口占用情况
1
sudo lsof -i :9113在已配置白名单的服务器上运行此命令,检查是否有输出
1
curl http://172.22.199.119:9113/metrics输出结果类似如下:
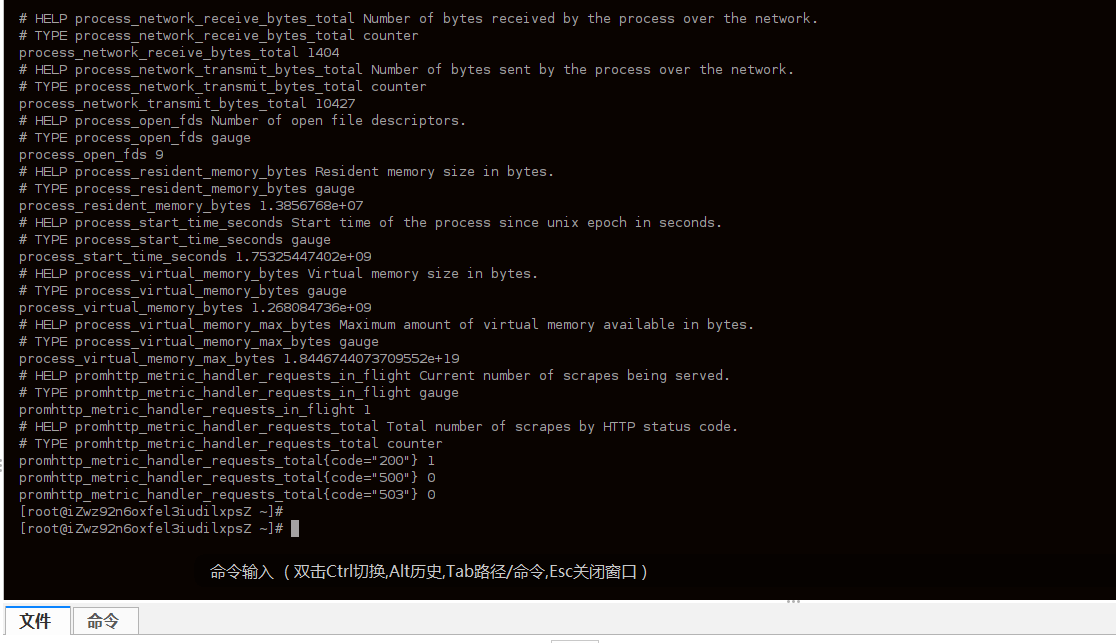
在 Prometheus 配置文件中添加以下内容,并重启 Prometheus
1
2
3
- job_name: 'nginx'
static_configs:
- targets: ['172.22.199.119:9113'] # 指向 Nginx Prometheus Exporter 的 IP 和端口问题:在 Grafana 中配置 Nginx 面板时遇到 “No Data” 错误,疑似 Prometheus 配置错误
1
进入 Prometheus Web UI 查看状态,发现没有问题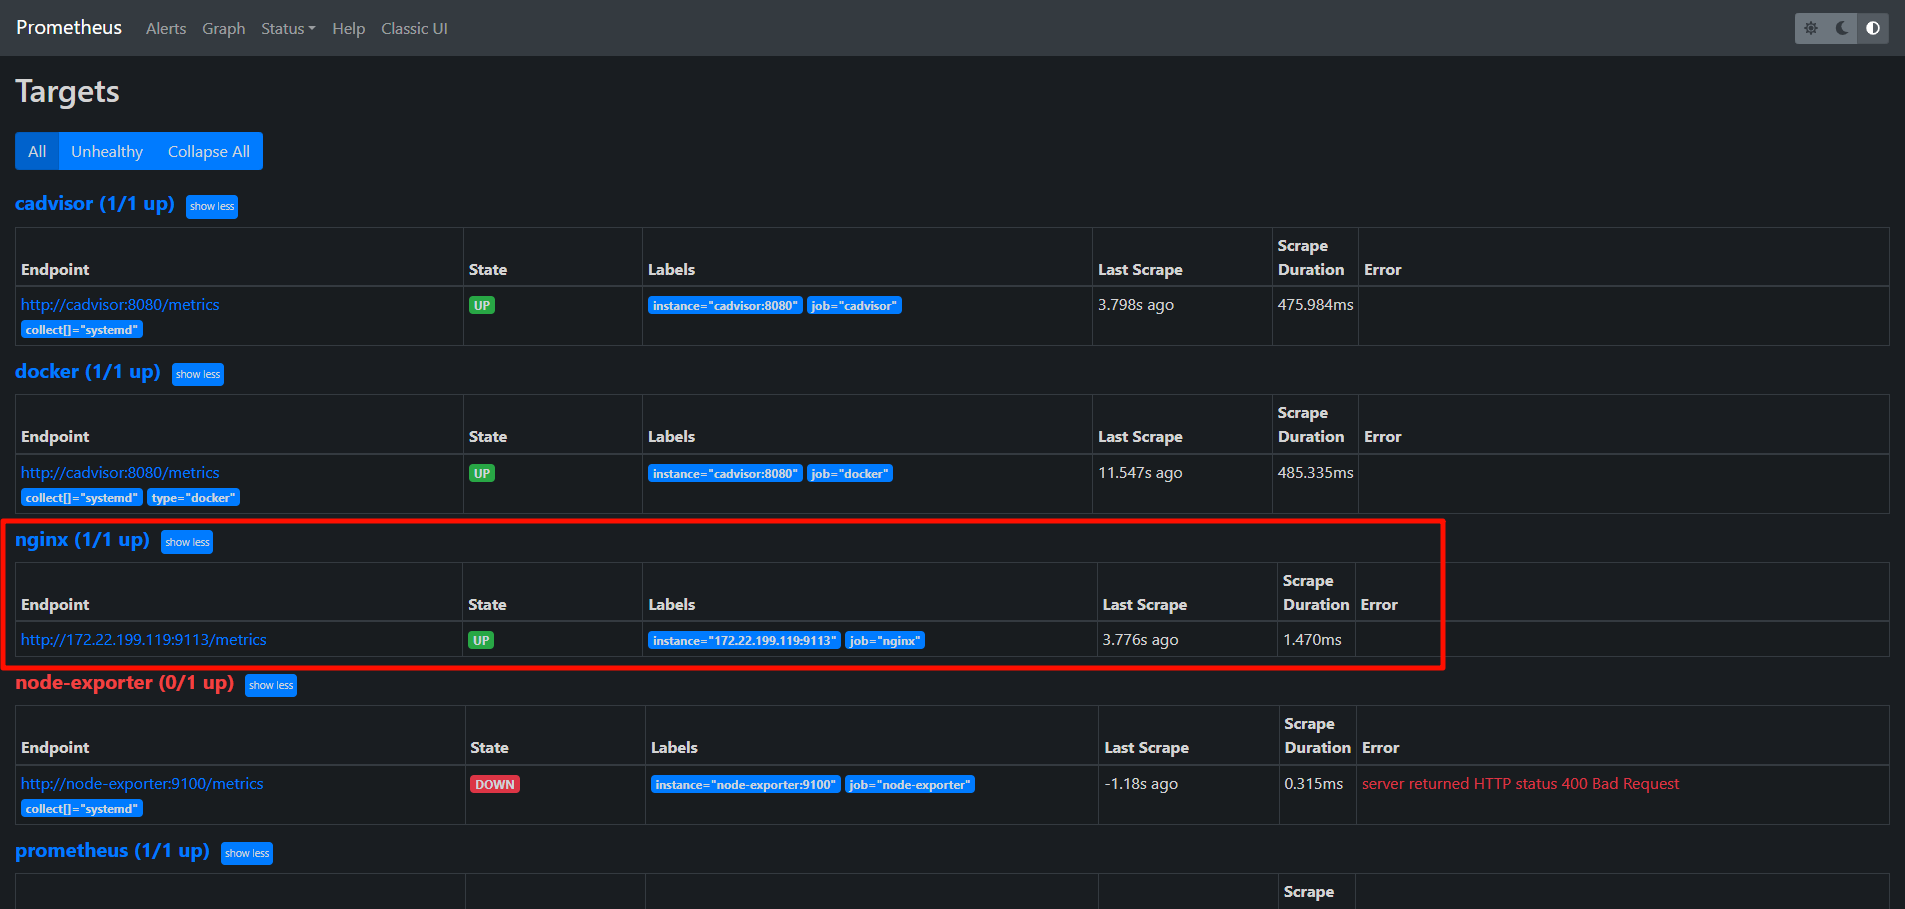
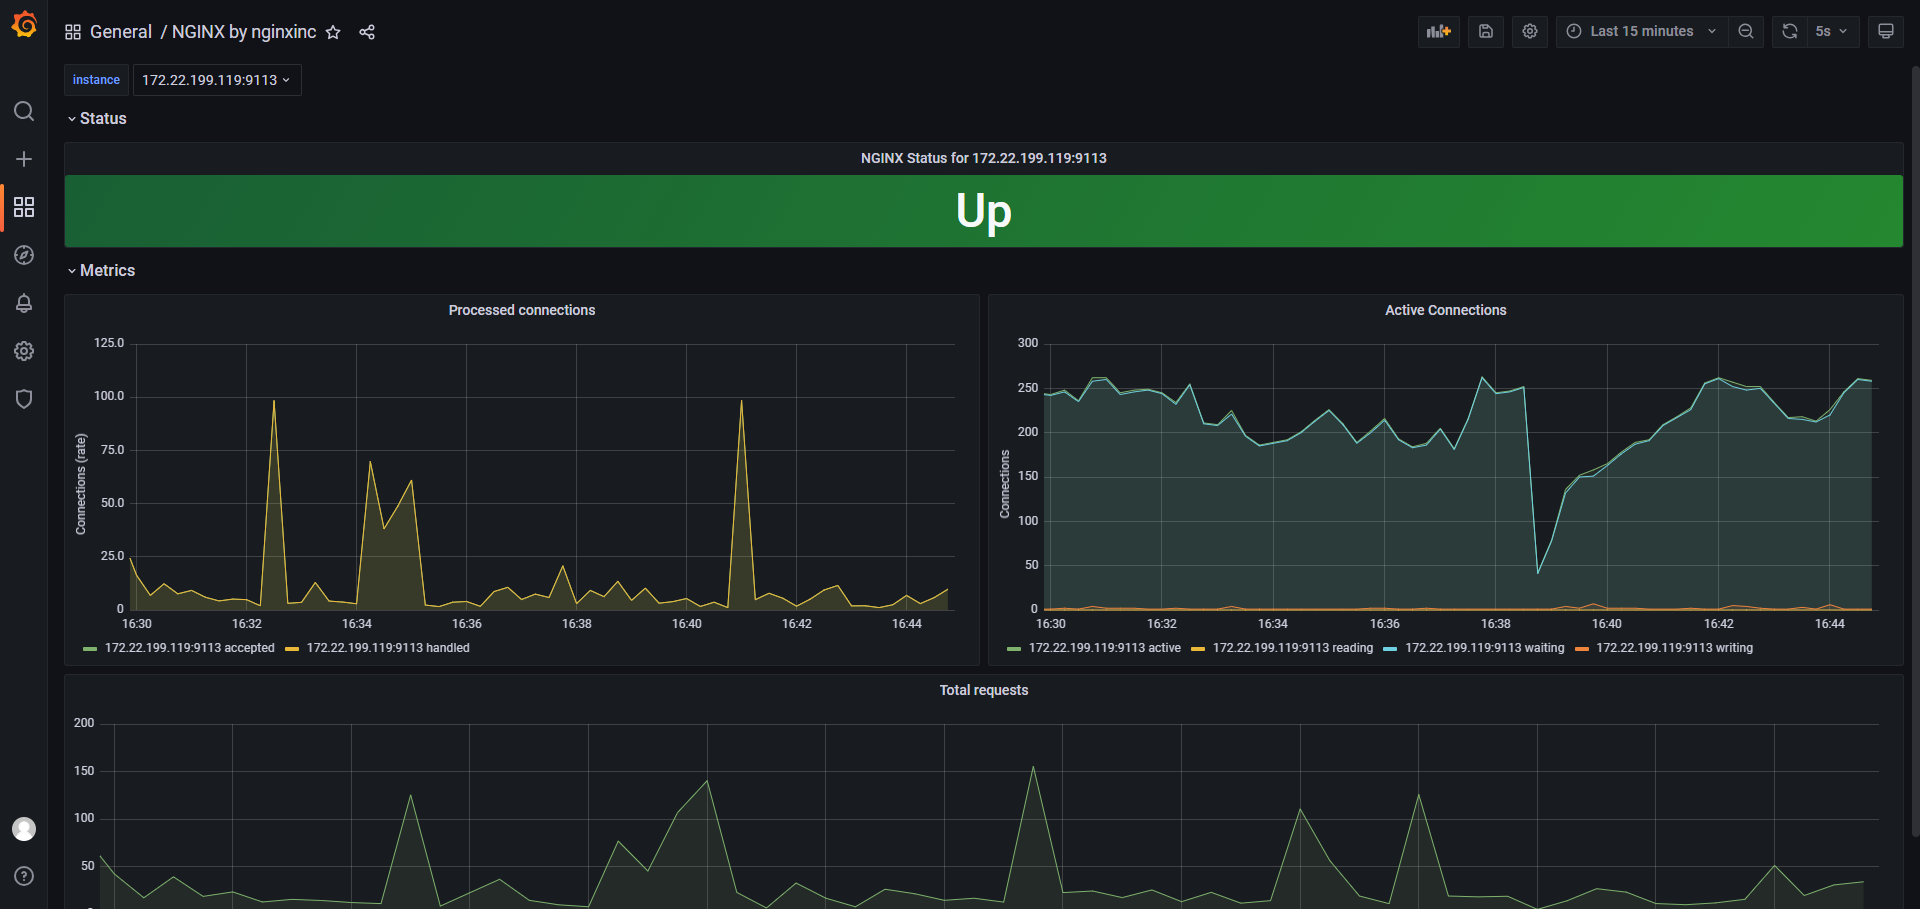
发现是 Grafana 面板选择错误
应该使用这个:https://grafana.com/grafana/dashboards/11199-nginx/面板正常显示
在另一台服务器上进行配置
配置 Nginx 启用 stub_status 模块
1
2
3
4
5
6
7
8
9
10
11
12
13
# 文件路径示例: /etc/nginx/conf.d/nginx_status_121.conf
server {
listen 8088; # 使用不常用的端口,例如 8088,确保不与 Nginx 对外服务端口冲突
server_name 172.22.199.121; # 监听这台 Nginx 服务器自己的 IP
location /nginx_status {
stub_status on;
# 允许 Nginx Prometheus Exporter 所在的 IP 地址访问
# Nginx Prometheus Exporter 将运行在这台服务器 (172.22.199.121) 上,所以允许本地访问
allow 127.0.0.1;
deny all; # 拒绝其他所有 IP 访问,增强安全性
}
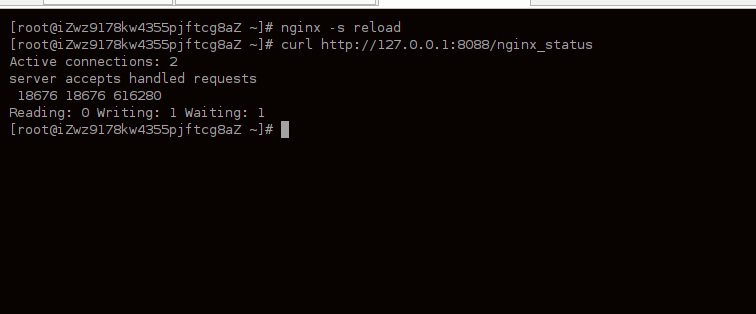
}测试 Nginx stub_status 页面
1
curl http://127.0.0.1:8088/nginx_status输出结果类似如下:
安装 Nginx Prometheus Exporter
1
2
3
4
5
6
7
8
9
10
11
nginx-exporter:
image: nginx/nginx-prometheus-exporter:latest # 使用 latest 标签
container_name: nginx-exporter # 容器名称与 docker run 一致
restart: unless-stopped # 等效于 docker run 的 -d (后台运行) 的持久化行为
# command 部分对应 docker run 中 --nginx.scrape-uri 参数后面的内容
command:
- '--nginx.scrape-uri=http://172.22.199.121:8088/nginx_status' # 与你的 docker run 命令一致
ports:
- "9113:9113" # 对应 docker run 的 -p 9113:9113
networks:
- my-custom-net # 加入你现有的网络验证是否安装成功
1
curl http://172.22.199.121:9113/metrics在 172.22.199.118(监控服务器,运行 Prometheus 和 Grafana)上操作
需要配置 Prometheus 以抓取新的 Nginx 服务器(172.22.199.121)上的 Nginx Exporter。
编辑 prometheus.yml 文件,在 scrape_configs 部分添加新的 job。1
2
3
4# 监控 Nginx 服务器 121
- job_name: 'nginx_server_121'
static_configs:
- targets: ['172.22.199.121:9113']重启 Prometheus 服务